
Guides > Using Foreground / Background SVG
Using Foreground / Background SVG
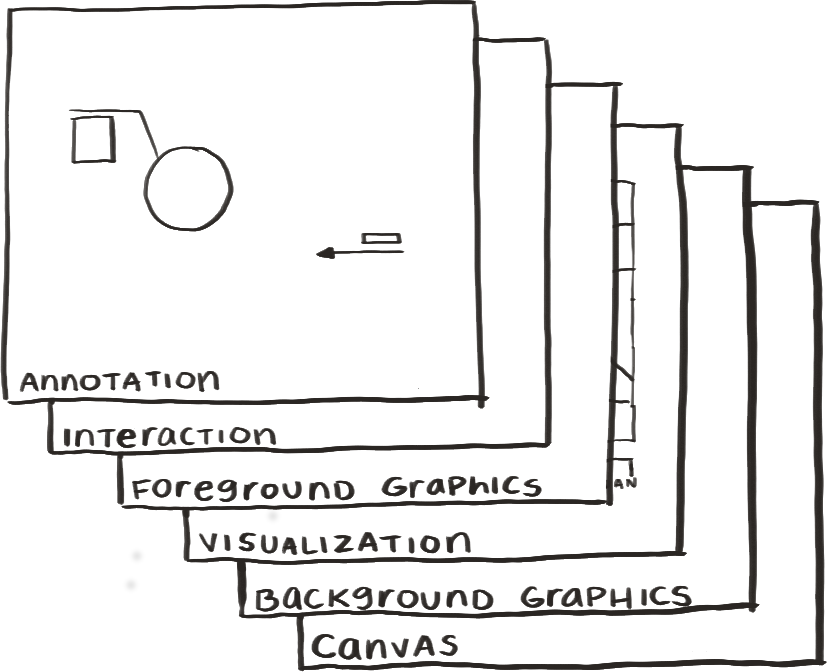
In each Frame, there is a svg behind the data visualization, backgroundGraphics, and one in front, foregroundGraphics. You can pass any svg elements you want to those layers to be rendered.
See the Homerun Map example for liberal use of backgroundGraphics, and the Radar Plot example for use of foregroundGraphics.